Activity Reports
 Updated
by
Arianne G.
Updated
by
Arianne G.
The following Activity reports are available in XactAnalysis® Quality Review (QR), depending on your company’s settings and your rights. See M.I. (Management Information) for help with generating reports.
For most reports, select a row heading in the table or a geographic/organisational area in the hierarchy tree to see data for other levels of your hierarchy.
Assignment Ageing
This report displays information about assignments with 1–2 weeks and 2+ weeks of inactivity, by area, adjuster/contractor, and claim reference. Inactive assignments have not been returned to XactAnalysis, cancelled, or rejected. This information helps to make you aware of adjusters/contractors with ageing assignments. Assignments are removed when they are returned, cancelled, or rejected.
The date range for this report is the 12 months prior to the report generation date. Ad hoc date ranges are not used, as the intent is to display current data rather than data for a specific period of time.
Columns
Assignment: Claim reference and adjuster/contractor
1-2 weeks since last activity: Number of aging assignments with 1-2 weeks of inactivity
2+ weeks since last activity: Number of aging assignments with 2+ weeks of inactivity
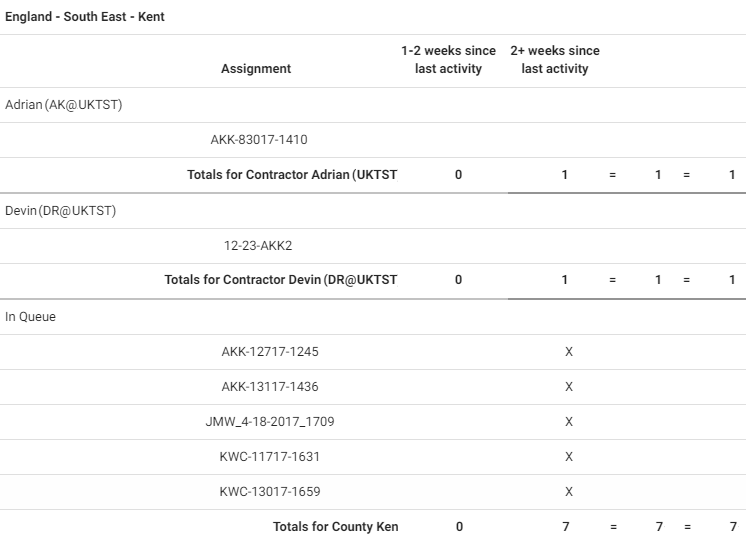
Assignment Ageing report
Assignment Summary
This report displays the statuses assignments receive during the report’s date range by region / office level. It further separates the assignment totals for some of the statuses by those with duplicate claim references and those without duplicate claim references. This report helps you track assignment activity volume by geographic/organisational area.
- Select a geographic/organisational area link to see data for different levels of your hierarchy, including individual estimates.
Columns
Received: Number of assignments received by XactAnalysis
- Claim: Number of unique claim references received, excluding any duplicates
- Assign: Number of all assignments received, including those with duplicate claim references
Delivered: Number of assignments downloaded to Xactimate
Returned: Number of estimates returned to XactAnalysis from the assignee
- Claim: Number of unique claim references returned, excluding duplicate claim references
- Assign: Number of all assignments returned, including those with duplicate claim references
Referrals: Number of referral assignments. An assignment is referred (or segmented) when more than one contractor is needed. For example, a damaged home may need a carpet contractor, a roofing contractor, and a drywall contractor. Each would receive a referral assignment.
Reassigned: Number of assignments reassigned to a different recipient. When an assignment is reassigned, a new assignment is actually created, but it keeps the original estimate line items. An assignment could be reassigned if an insurer wanted a second opinion.
Corrected: Number of corrected estimates uploaded to XactAnalysis
Cancelled: Number of assignments cancelled by the insurer and notifications to assignment recipient sent
- Claim: Number of unique claim references cancelled, excluding duplicates
- Assign: Number of assignments cancelled, including those with duplicate claim references
Rejected: Number of assignments rejected/deleted by assignment recipient and notifications to insurer sent
- Claim: Number of unique claim references rejected, excluding duplicates
- Assign: Number of assignments rejected, including those with duplicate claim references
Total In Progress: Number of assignments not returned to XactAnalysis by a recipient. These assignments will have an assignment status of In Assign Queue (not assigned to a recipient), Notification Pending (assigned, but recipient has not received notification), Notified (recipient notified), or Delivered (downloaded to Xactimate).
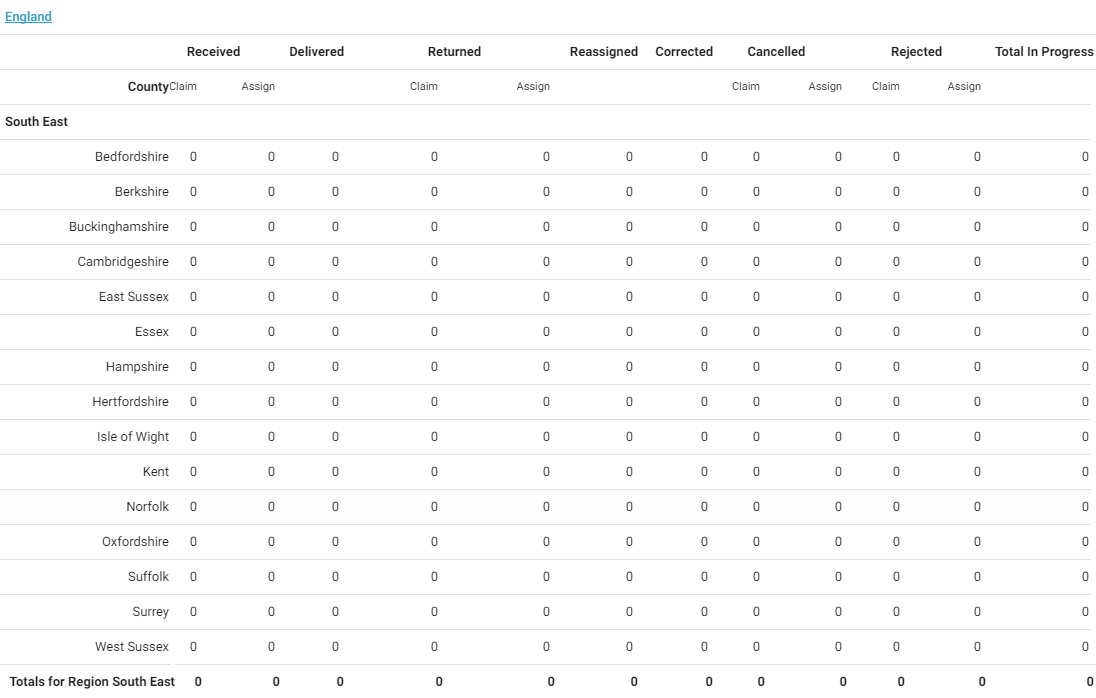
Assignment Summary report
Average File Size
This report displays the total and average file size and value of estimates, by adjuster/contractor. File size is influenced by custom documents, photos, and sketch files uploaded from Xactimate or through XactAnalysis for Service Providers (SP). This report helps you administer computer disc space.
- Select an adjuster/contractor to view estimate details.
Columns
Individual: Adjuster/contractor name and XactNet address
Estimates: Number of estimates
Total File Size (MB): Total file size of estimates, in megabytes
Avg File Size (MB): Average estimate file size, in megabytes (Total File Size / Estimates)
Total Estimate Value: Total value of estimates
Avg Estimate Value: Average estimate value (Total Estimate Value / Estimates)
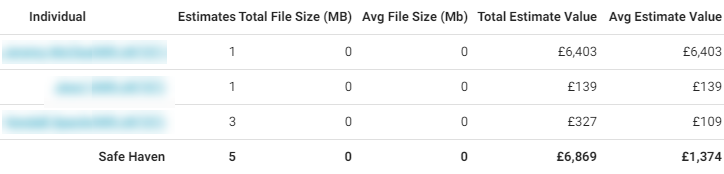
Average File Size report
Adjuster/Contractor Activity
This report displays the statuses of assignments by adjuster/contractor, helping you monitor adjuster/contractor assignment activity.
- Select an adjuster/contractor name to view estimate details, including the date and time each status was reached.
Columns
Adjuster/Contractor: Assignee name and XactNet address
Notified: Number of assignments where the assignee was notified
Delivered: Number of assignments downloaded to Xactimate
Returned: Number of estimates exported to insurer or there is no export
Referrals: Number of referral assignments.
Reassigned: Number of assignments reassigned to a different assignee
Corrected: Number of corrected estimates uploaded to XactAnalysis
Cancelled: Number of assignments cancelled by the insurer and notifications to assignment assignees sent
Rejected: Number of assignments rejected/deleted by assignment assignee and notifications to insurer sent
Total In Progress: Number of assignments not returned to XactAnalysis by an assignee. These will have an assignment status of In Assign Queue (not assigned to an assignee), Notification Pending, Notified (assignee notified), or Delivered (downloaded to Xactimate).
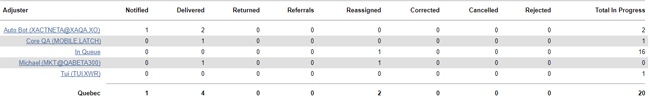
Adjuster/Contractor Activity report
Estimate Collaboration Summary
This report displays the number of estimates where collaboration occurred and the details of the collaborations. Collaboration occurs when an assignment is assigned to a collaborating adjuster who reviews the assignment and makes corrections using Xactimate while the original adjuster is locked out. The original adjuster can pick up the assignment again when the collaborating adjuster is finished. This report allows you to review original estimates for accuracy through comparison of original and collaborated estimates.
- Select a geographic/organisational area link to see data for different levels of your hierarchy, including individual estimates.
Columns
Program Location: Geographic/organisational area
Total Estimates: Total number of estimates
Total Collaborated: Total number of collaborated estimates
# Assigned: Number of estimates assigned to a collaborator
# Returned: Number of estimates marked completed and uploaded by a collaborator
Avg. Collaboration Days: Average number of days the collaboration lasted
Total Estimate Amount: Total estimate value before collaborations
Total Corrected Amount: Total value of corrected estimates
% Collaborated Estimates: Percent of total estimates collaborated
£ Difference (Overall): Difference in value between original estimates and collaborated estimates (last uploaded estimates)
£ Difference (Up): Difference in value between original estimates and collaborated estimates (last uploaded estimates) if they increased in value
£ Difference (Down): Difference in value between original estimates and collaborated estimates (last uploaded estimates) if they decreased in value
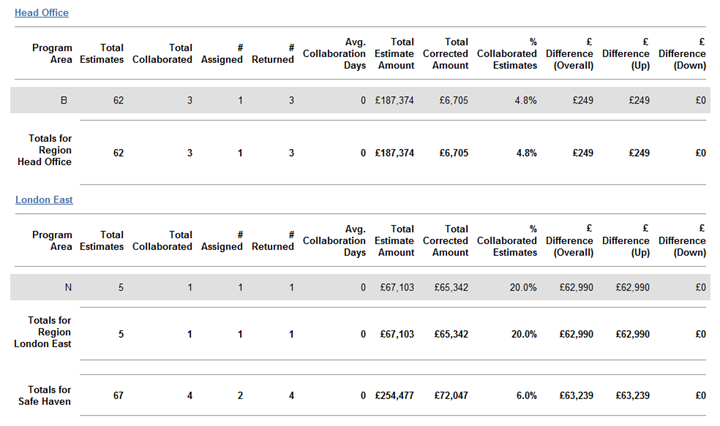
Estimate Collaboration Summary report
Estimate Correction Summary
This report displays the number of corrections on each estimate and cost total differences between the first and last uploaded estimate. This report helps you track corrections on estimates and monitor the difference corrections make in the final estimate value.
- Select a geographic/organisational area link to see data for different levels of your hierarchy, including individual estimates.
Columns
Returned: Number of returned (initial) estimates
Corrected: Number of corrected (final) estimates
Avg Corrections per Estimate: Average number of corrections uploaded for each returned (initial) estimate (Total # of Corrections column total in Program Area table divided by number of Returned estimates in Region / Office Level table).
Initial Est Value: Value of returned (initial) estimates
Final Est Value: Value of corrected (final) estimate
% Difference (Overall): Percentage of change between Initial Est Value and Final Est Value. This number can be positive or negative.
£ Difference (Overall): Difference between Final Estimate Value and Initial Estimate Value (Final Est Value – Initial Est Value). This amount can be positive or negative.
% Difference (Up): Percentage of increase from Initial Estimate Value to Final Estimate Value
£ Difference (Up): Amount of increase from Initial Estimate Value to Final Estimate Value (Final Est Value – Initial Est Value)
% Difference (Down): Percentage of decrease from Initial Estimate Value to Final Estimate Value
£ Difference (Down): Amount of decrease from Initial Estimate Value to Final Estimate Value (Initial Est Value – Final Est Value)
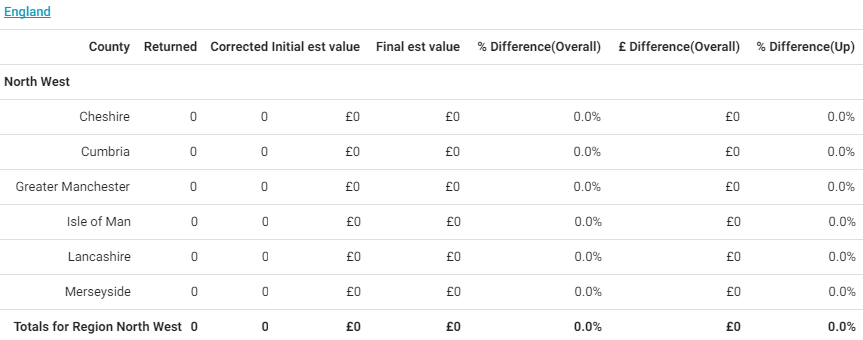
Estimate Correction Summary report
Estimate Review Summary
This report displays information about each of the assigned reviewers, including number of reviews assigned, accepted, completed, and outstanding. It also displays the time it took for the reviewer to accept each review, and the average review time. This report helps you monitor your reviewers’ productivity.
Columns
Reviewer: Reviewer name
Estimates Reviewed Assigned: Number of estimates assigned to the reviewer
Estimates Reviewed Accepted: Number of estimate reviews accepted by the reviewer
Estimates Reviewed Completed: Number of estimate reviews completed by the reviewer
Estimates Reviewed Outstanding: Number of estimates still in progress (Assigned estimates - Completed estimates). The estimate will have any review status except Review Completed.
Time to Accept (Hours): Number of hours reviewer took to accept the review (Number of hours between Assigned and Accepted)
0-1 Hours
1-5 Hours
5-10 Hours
10+ Hours
Avg. Review Time (Hours): Average number of hours reviewer took to complete the review (Number of hours between Assigned and Completed)
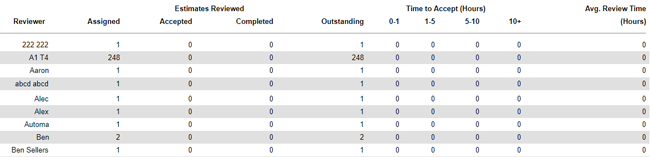
Estimate Review Summary report
Summarised Executive Overview
This report displays assignment statuses. If an assignment progressed through multiple statuses during the date range of the report, the report would count each of the statuses. For example, if an adjuster/contractor was notified about an assignment, the assignment was downloaded by the adjuster/contractor, and the estimate was uploaded to XactAnalysis during the report’s date range, the report would show a count for Notified, Delivered, and Returned.
- Select a geographic/organisational area link to see data for different levels of your hierarchy, including individual estimates.
Columns
Program Area: Geographic/organisational area
Notified: Number of assignments where the recipient was notified
Delivered: Number of assignments downloaded to Xactimate
Returned: Number of estimates exported to insurer or there is no export
Referrals: Number of referral assignments. An assignment is referred (or segmented) when more than one adjuster/contractor is needed. For example, a damaged home may need a carpet contractor, a roofing contractor, and a drywall contractor. Each would receive a referral assignment.
Reassigned: Number of assignments reassigned to a different recipient. A new assignment is actually created, but it keeps the original estimate line items. An assignment could be reassigned if an insurer wanted a second opinion.
Corrected: Number of corrected estimates uploaded to XactAnalysis
Cancelled: Number of assignments cancelled by the insurer and notifications to assignment recipients sent
Rejected: Number of assignments rejected/deleted by assignment recipient and notifications to insurer sent
Total In Progress: Number of assignments not returned to XactAnalysis by an adjuster/contractor. These assignments have an assignment status of In Assign Queue (not assigned to a recipient), Notification Pending, Notified (recipient notified), or Delivered (downloaded to Xactimate).
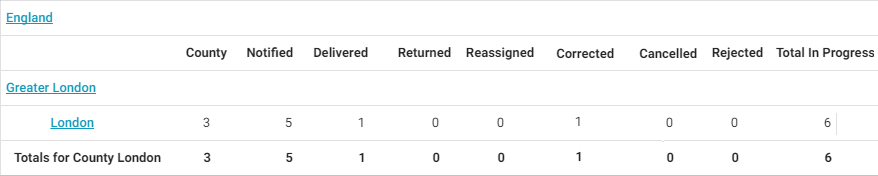
Summarised Executive Overview report
User Productivity
This report displays the volume and rate of items added and priced, by vendor. This helps you see the productivity of specific vendors.
- Select a vendor to view information for individual estimates.
Columns
Name: Vendor name
User: Vendor user name
Email: Vendor email
Contents Collab Items Added: Number of line items that were added through the contents collaboration process
Excel Items Added: Number of line items that were added using an Excel worksheet
Normal Items Added: Number of items that were added normally
Items Priced: Number of items priced
Change in Number of Items: Total number of items changed
Elapsed Time (hours): Number of hours logged into XactContents
Avg. Items Added per Hour: Average number of items added per hour
Avg. Items Priced per Hour: Average number of items priced per hour
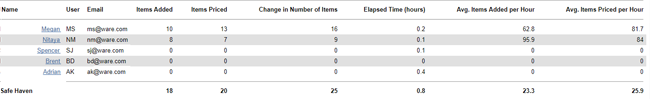
User Productivity report
Xactimate Versions and Profiles
This report displays information about the Xactimate setup for each user, including version, minor version, last connect date, and last estimate upload date. This report allows you to verify that Xactimate users have the proper version of the software.
- Select an Xactimate user to view profile information.
Columns
Xactimate Version: Xactimate version (based on the user’s last connection to XactAnalysis)
Minor Version: Xactimate minor version (based on the user’s last connection to XactAnalysis)
Last Connect Date: Date the user last connected to XactAnalysis
Last Estimate Upload Date: Date the user last successfully uploaded an estimate to XactAnalysis
Rows
Adjuster/contractor
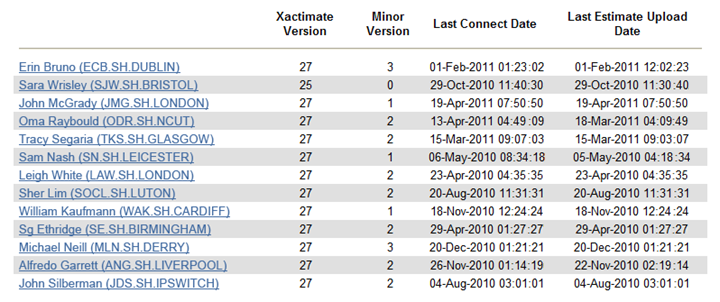
Xactimate Versions and Profiles report