Quality Review Management Reports
 Updated
by
Arianne G.
Updated
by
Arianne G.
- Estimate Reinspection Questions Criteria
- Estimate Reinspection Results by Category
- Estimate Reinspection Results by Cause of Loss
- Estimate Reinspection Results by Reason
- Estimate Reinspection Results by Type of Loss
- Reinspection Questions Criteria by Reinspector
- Reinspection Questions Criteria by Adjuster
- Estimate Recipient Reinspection Summary
- Estimate Reinspector Summary
- Estimate Recipient Reinspection Summary—Filtered
- Onsite vs. Desk Reinspection
- Reinspector Productivity
- Columns
- Reinspector Productivity—Filtered
- Vendor Reinspection
- Estimate Claim Review Questions Criteria
- Estimate Claim Review Results by Category
- Overwrite Amounts graph
- Underwrite Amounts graph
- Estimate Claim Review Results by Cause of Loss
- Table rows
- Estimate Claim Review Results by Reason
- Estimate Claim Review Results by Type of Loss
- Estimate Calibration Results by Reason
- Calibration Activity
The following Quality Review management reports are available in XactAnalysis® Quality Review (QR), depending on your company’s settings and your rights. See Management and Activity Reports for help with generating reports.
Estimate Reinspection Questions Criteria
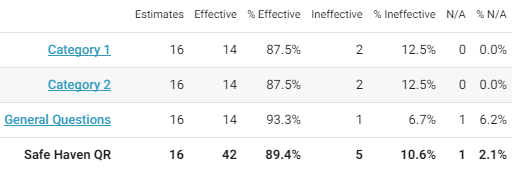
This report displays the percentage of estimates categorized as Effective, Ineffective, or N/A for each category on the Reinspection Form. Only the most current completed reinspection for each estimate is included in the report.
- Select a bar in the graph or a link in the table to see company-wide data for that category. In the company-wide level, select your company name or bars in the graph to see data for other levels of your hierarchy.
- Hover over the bars in the graph to see the number of estimates.
Reinspection Questions Criteria graph
This graph shows the percentage of estimates that were effective, ineffective, and N/A for the following categories on the Reinspection Form: Coverage Verifications, Customer Services, and Investigate Assignment.
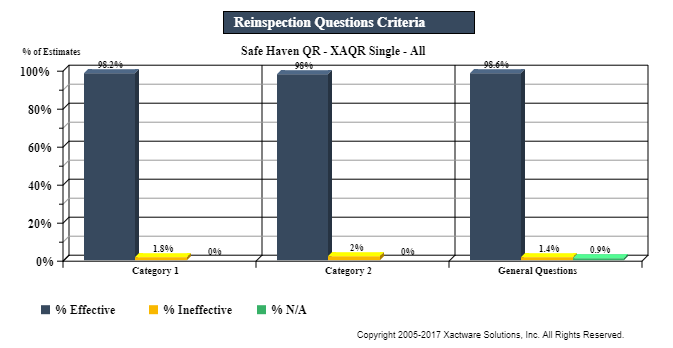
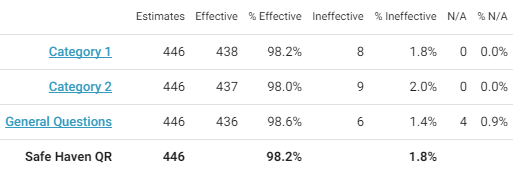
Table columns
Estimates: Total number of estimates
Effective: Number of estimates rated Effective
% Effective: Percentage of estimates rated Effective
Ineffective: Number of estimates rated Ineffective
% Ineffective: Percentage of estimates rated Ineffective
N/A: Number of estimates rated Not Applicable
%N/A: Percentage of estimates rated Not Applicable
Table rows
Reinspection Form categories
Data Set (Safe Haven): Totals
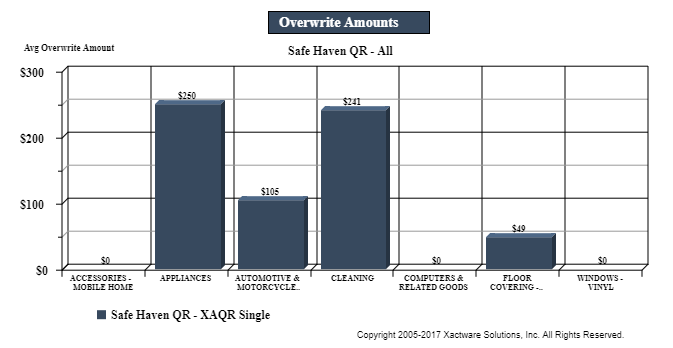
Estimate Reinspection Results by Category
This report displays the number and value of overwrites and underwrites reported during the reinspection process for each price list category. Only the most current completed reinspection for each estimate is included in the report.
- Select a bar in the graph or a link in the table to see data for other levels of your hierarchy.
- Hover over the bars in the graph to see the total value.
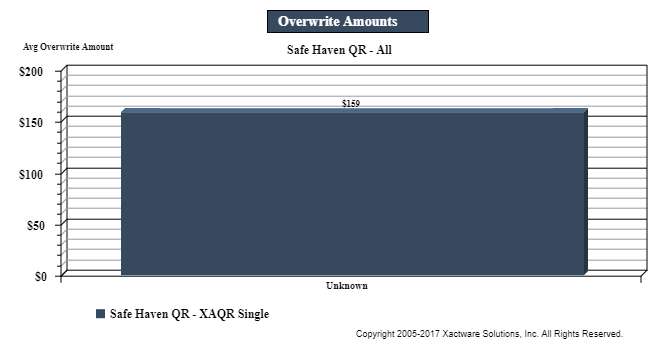
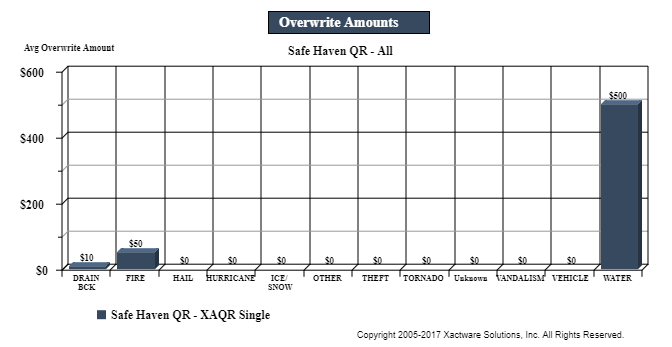
Overwrite Amounts graph
This graph shows the average overwrite dollar amounts for the categories that were selected in the Estimate Exceptions section of the Reinspection Form.
Underwrite Amounts graph
This graph shows the average underwrite dollar amounts for the categories that were selected in the Estimate Exceptions section of the Reinspection Form.
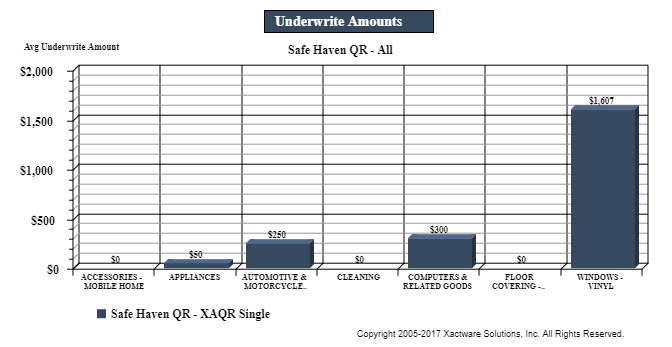
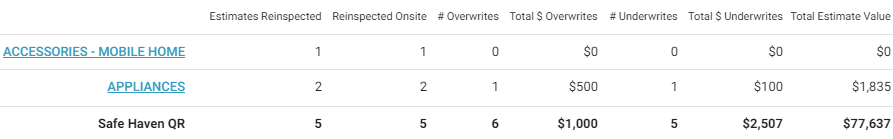
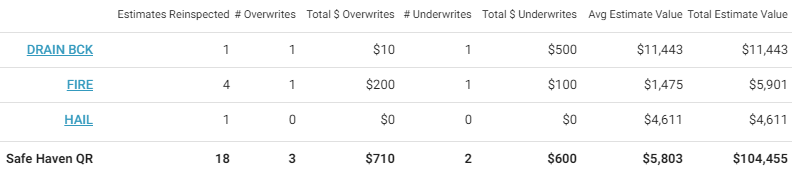
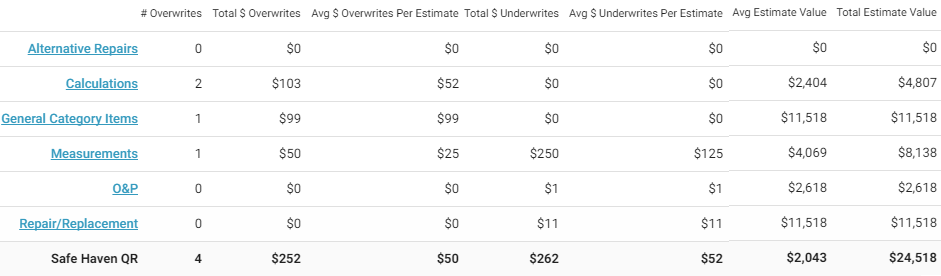
Table columns
Estimates Reinspected: Number of estimates reinspected
Reinspected onsite: Number of estimates reinspected onsite
# Overwrites: Number of reinspected estimates with overwrites
Total $ Overwrites: Total value of overwrites
Avg $ Overwrites Per Estimate: Average value of overwrites per estimate (Total $ Overwrites / Estimates Reinspected)
# Underwrites: Number of reinspected estimates with underwrites
Total $ Underwrites: Total value of underwrites
Avg $ Underwrites Per Estimate: Average value of underwrites per estimate (Total $ Underwrites / Estimates Reinspected)
Avg Estimate Value: Average estimate value (Total Estimate Value / Estimates Reinspected)
# QA Approved: Number of QA approved estimates
Total Estimate Value: Total estimate value
Table rows
Price list categories
Data Set (Safe Haven): Totals
Estimate Reinspection Results by Cause of Loss
This report displays the number and value of overwrites and underwrites reported during the reinspection process for each cause of loss. Only the most current completed reinspection for each estimate is included in the report.
- Select a bar in the graph or a link in the table to see data for other levels of your hierarchy.
- Hover over the bars in the graph to see the total value.
Overwrite Amounts graph
This graph shows the average overwrite dollar amounts for the cause of loss categories.
Underwrite Amounts graph
This graph shows the average underwrite dollar amounts for the cause of loss categories.
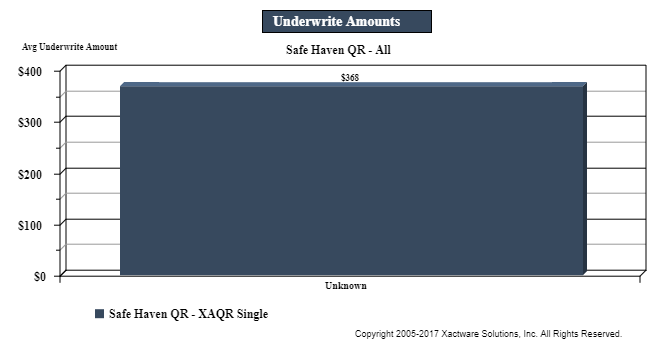
Table columns
Estimates Reinspected: Number of estimates reinspected
Reinspected onsite: Number of estimates reinspected onsite
# Overwrites: Number of reinspected estimates with overwrites
Total $ Overwrites: Total value of overwrites
Avg $ Overwrites Per Estimate: Average value of overwrites per estimate (Total $ Overwrites / Estimates Reinspected)
# Underwrites: Number of reinspected estimates with underwrites
Total $ Underwrites: Total value of underwrites
Avg $ Underwrites Per Estimate: Average value of underwrites per estimate (Total $ Underwrites / Estimates Reinspected)
Avg Estimate Value: Average estimate value (Total Estimate Value / Estimates Reinspected)
# QA Approved: Number of QA approved estimates
Total Estimate Value: Total estimate value
Table rows
Cause cause of loss categories
Data Set (Safe Haven): Totals
Estimate Reinspection Results by Reason
This report displays the number and value of overwrites and underwrites reported during the reinspection process for each reason on the Reinspection Form. Only the most current completed reinspection for each estimate is included in the report.
- Select a bar in the graph or a link in the table to see data for other levels of your hierarchy.
- Hover over the bars in the graph to see the total value.
Overwrite Amounts graph
This graph shows the average overwrite dollar amounts for the reasons that were selected in the Estimate Exceptions section of the Reinspection Form.
Underwrite Amounts graph
This graph shows the average underwrite dollar amounts for the reasons that were selected in the Estimate Exceptions section of the Reinspection Form.
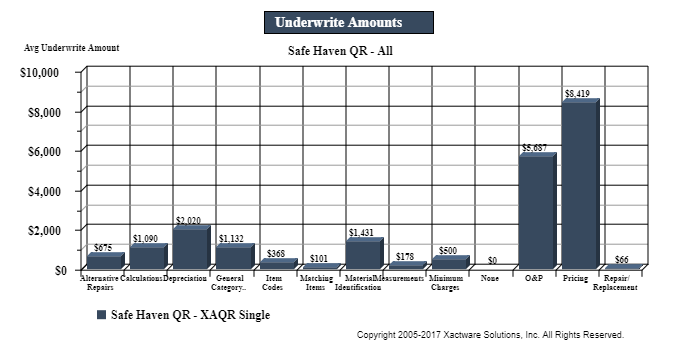
Table columns
Estimates Reinspected: Number of estimates reinspected
Estimates Reinspected with Findings: Number of estimates reinspected with findings
Reinspected Onsite: Number of estimates reinspected onsite
# Overwrites: Number of reinspected estimates with overwrites
Total $ Overwrites: Total value of overwrites
Avg $ Overwrites Per Estimate: Average value of overwrites per estimate (Total $ Overwrites / Estimates Reinspected)
Total Overwrites to Total Estimate $: Ratio of total overwrites value to total estimate value
# Underwrites: Number of reinspected estimates with underwrites
Total $ Underwrites: Total value of underwrites
Avg $ Underwrites Per Estimate: Average value of underwrites per estimate (Total $ Underwrites / Estimates Reinspected)
Total Underwrites to Total Estimate $: Ratio of total underwrites value to total estimate value
Avg Estimate Value: Average estimate value (Total Estimate Value / Estimates Reinspected)
# QA Approved: Number of QA approved estimates
Total Estimate Value: Total estimate value
Table rows
Reason categories
Data Set (Safe Haven): Totals
Estimate Reinspection Results by Type of Loss
This report displays the number and value of overwrites and underwrites reported during the reinspection process for each type of loss on the Reinspection Form. Only the most current completed reinspection for each estimate is included in the report.
- Select a bar in the graph or a link in the table to see data for other levels of your hierarchy.
- Hover over the bars in the graph to see the total value.
Overwrite Amounts graph
This graph shows the average overwrite dollar amounts for types of loss.
Underwrite Amounts graph
This graph shows the average underwrite dollar amounts for types of loss.
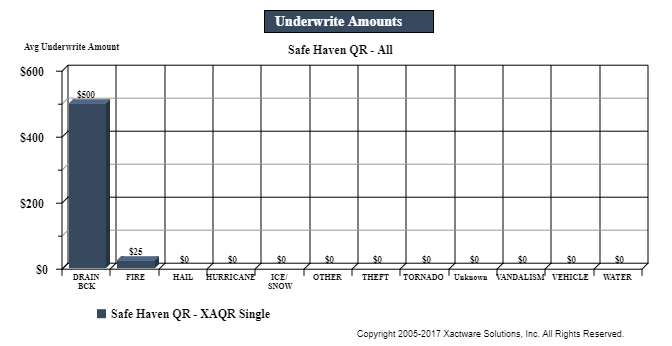
Table columns
Estimates Reinspected: Number of estimates reinspected
Reinspected onsite: Number of estimates reinspected onsite
# Overwrites: Number of reinspected estimates with overwrites
Total $ Overwrites: Total value of overwrites
Avg $ Overwrites Per Estimate: Average value of overwrites per estimate (Total $ Overwrites / Estimates Reinspected)
# Underwrites: Number of reinspected estimates with underwrites
Total $ Underwrites: Total value of underwrites
Avg $ Underwrites Per Estimate: Average value of underwrites per estimate (Total $ Underwrites / Estimates Reinspected)
Avg Estimate Value: Average estimate value (Total Estimate Value / Estimates Reinspected)
# QA Approved: Number of QA approved estimates
Total Estimate Value: Total estimate value
Table rows
Type of Loss categories
Hierarchy level (Kansas): Totals
Reinspection Questions Criteria by Reinspector
This report displays the percentage of estimates categorized as Effective, Ineffective, or N/A for each category on the Reinspection Form. Only the most current completed reinspection for each estimate is included in the report.
- Select a bar in the graph or a link in the table to see data for other levels of your hierarchy, including by reinspector.
- Hover over the bars in the graph to see the number of estimates.
Reinspection Questions Criteria graph
This graph shows the percentage of estimates that were effective, ineffective, and N/A for the following categories on the Reinspection Form: Coverage Verifications, Customer Services, and Investigate Assignment.
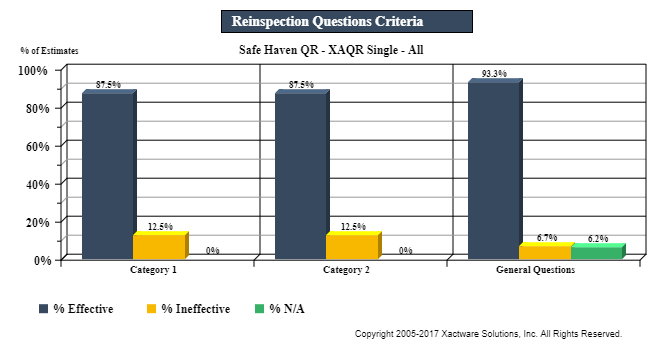
Table columns
Estimates: Total number of estimates
Effective: Number of estimates rated Effective
% Effective: Percentage of estimates rated Effective
Ineffective: Number of estimates rated Ineffective
% Ineffective: Percentage of estimates rated Ineffective
N/A: Number of estimates rated Not Applicable
%N/A: Percentage of estimates rated Not Applicable
Table rows
Reinspection Form categories
Data Set (Safe Haven): Totals
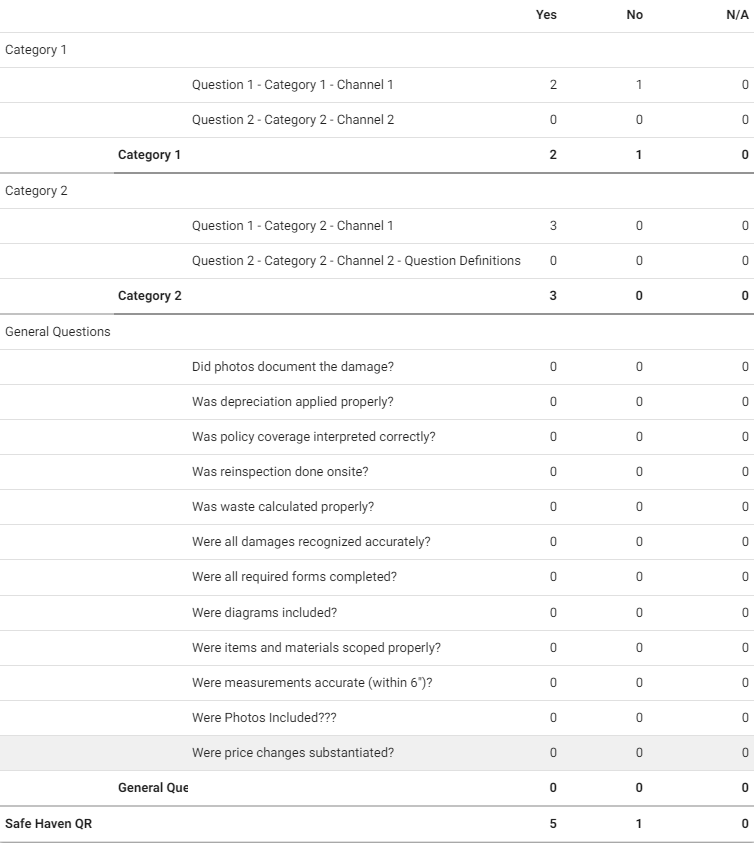
Reinspection Questions Criteria by Adjuster
This report displays the reinspection form questions by the adjuster who originally wrote the estimate. It shows the total number of Yes, No, and Not Applicable responses to each question on the reinspection form. This enables you to determine how your adjusters are evaluated by reinspectors and find areas for improvement. Only the most current completed reinspection for each estimate is included in the report.
- Select an adjuster link to see other levels of you hierarchy, including individual estimates.
Columns
Adjuster: The name and XactNet address of the adjuster who completed the estimates
Questions: Each question from the reinspection form. These questions vary by company.
Total Reinspections: Number of estimates completed by the adjuster that have been reinspected
Total Yes Responses: Number of Yes responses by question
Total No Responses: Number of No responses by question
Total N/A Responses: Number of Not Applicable responses by question
Estimate Recipient Reinspection Summary
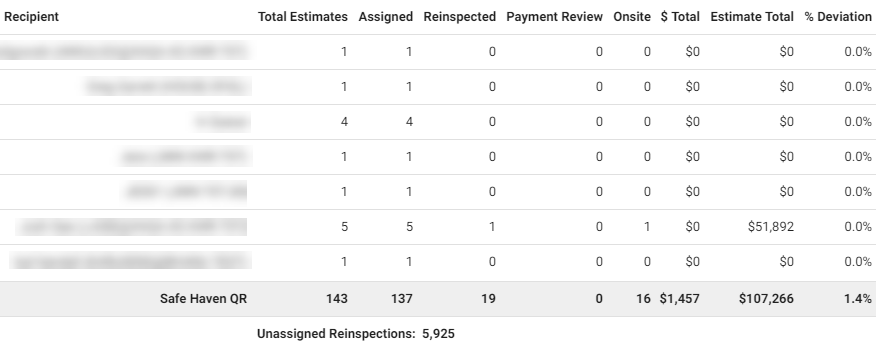
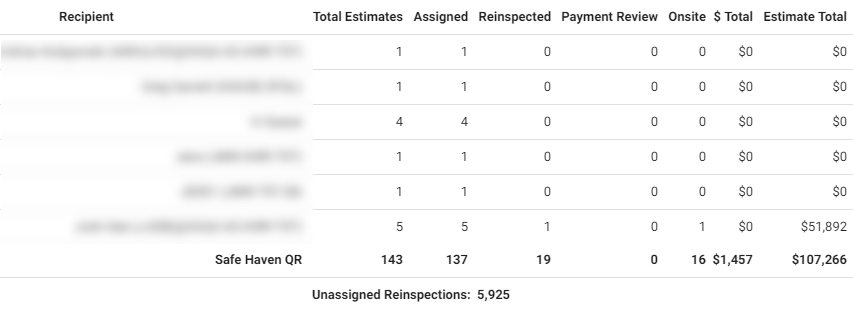
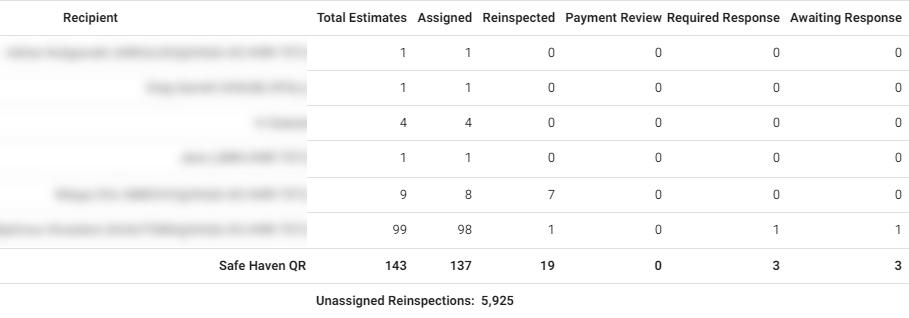
This report displays the reinspection activity for original recipients’ estimates, and calculates reinspection activity totals for a data set. Only the most current completed reinspection for each estimate is included in the report.
Columns
Recipient: Individual who wrote the original estimate
Total Estimates: Total number of estimates
Assigned: Number of estimates assigned to a recipient
Reinspected: Number of estimates reinspected
Payment Review: Number of payment reviews
Onsite: Number of onsite reviews/reinspections completed onsite
Required Response: Number of estimates marked Response Required
Awaiting Response: Number of estimates awaiting response
# Overwrites Found: Number of overwrites found in reinspected estimates
# Underwrites Found: Number of underwrites found in reinspected estimates
$ Overwrites Found: Value of overwrites found
$ Underwrites Found: Value of underwrites found
$ Total: Total value of overwrites and underwrites ($ Overwrites Found + $ Underwrites Found)
Estimate Total: Total estimate value
% Deviation: Percentage the reinspection deviated from the original estimate total
Economic Opportunity: The sum of overwrites minus the sum of underwrites
% Economic Opportunity: Economic Opportunity’s percentage of Original Estimate Value
Estimate Reinspector Summary
This report displays the reinspection activity for reinspectors. This report also includes reinspections completed for reassigned estimates. Only the most current completed reinspection for each estimate is included in the report.
Columns
Reinspector: Individual assigned to reinspect the estimate
Assigned: Number of reinspections assigned
Reinspected: Number of reinspections completed
Payment Review: Number of estimates with a payment review reinspected
Onsite: Number of reinspections completed onsite
Required Response: Number of reinspections with a required response
Awaiting Response: Number of reinspections awaiting response
# Overwrites Found: Number of overwrites found in reinspected estimates
# Underwrites Found: Number of underwrites found in reinspected estimates
$ Overwrites Found: Value of overwrites found
$ Underwrites Found: Value of underwrites found
$ Total: Total value of overwrites and underwrites ($ Overwrites Found + $ Underwrites Found)
Avg/ Reinspect Time (Days): Average time to complete a reinspection
Estimate Total: Total estimate value
% Deviation: Percentage the reinspection deviated from the original estimate total
Post Review Adjustment: Value of post-review adjustments
Economic Opportunity: The sum of overwrites minus the sum of underwrites
% Economic Opportunity: Economic Opportunity’s percentage of Original Estimate Value
Estimate Recipient Reinspection Summary—Filtered
This report compares a reinspection to a filtered section of an estimate rather than the estimate total. The data in this report comes from filtered reinspections performed in Xactimate.
Columns
Recipient: Individual who wrote the original estimate
Total Estimates: Total number of estimates
Assigned: Number of estimates assigned to an assignee
Reinspected: Number of estimates reinspected
Payment Review: Number of payment reviews
Onsite: Number of reviews/reinspections completed onsite
Required Response: Number of estimates marked Response Required
Awaiting Response: Number of estimates awaiting responses
# Overwrites Found: Number of overwrites found in reinspected estimates
# Underwrites Found: Filtered Value of underwrites found
$ Overwrites Found: The value of overwrites found within the selected area
$ Underwrites Found: Filtered Value of underwrites found
$ Total: Filtered Total Value of overwrites and underwrites ($ Overwrites Found + $ Underwrites Found)
Filtered Total: Total value for filtered area
% Deviation: Percentage the reinspection deviated from the filtered value
Economic Opportunity: The sum of overwrites minus the sum of underwrites for the filtered estimate
% Economic Opportunity: Economic Opportunity's percentage of the filtered value
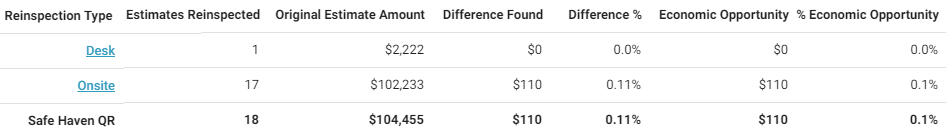
Onsite vs. Desk Reinspection
This report compares onsite reinspections with desk reinspections, helping you see the effectiveness of each. Only the most current completed reinspection for each estimate is included in the report.
Columns
Reinspection Type: Desk or Onsite
Estimates Reinspected: Number of estimates reinspected
Original Estimate Amount: Original estimate dollar amount
Total $ Overwrites: Dollar amount of overwrites
Total $ Underwrites: Dollar amount of underwrites
Difference Found: Dollar amount difference between original estimates and reinspections
Difference %: Percentage difference between reinspection value and original estimate value
Economic Opportunity: The difference of the sum of overwrites and the sum of underwrites (Total $ Overwrites – Total $ Underwrites)
% Economic Opportunity: Economic Opportunity’s percentage of Original Estimate Value
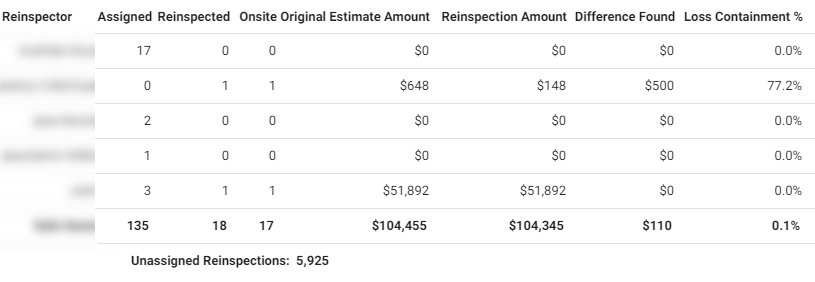
Reinspector Productivity
This report displays reinspections data by reinspector, helping you monitor reinspector productivity. Only the most current completed reinspection for each estimate is included in the report.
Columns
Reinspector: Reinspector name
Assigned: Reinspections assigned
Reinspected: Completed reinspections
Onsite: Onsite reinspections completed
Original Estimate Amount: Original estimate dollar amount
Reinspection Amount: Reinspection dollar amount
Difference Found: Dollar amount difference between original estimates and reinspections (Reinspection Amount - Original Estimate Amount)
Loss Containment %: Percentage difference between reinspection value and original estimate value
Economic Opportunity: The sum of overwrites minus the sum of underwrites (Total $ Overwrites – Total $ Underwrites)
% Economic Opportunity: Economic Opportunity’s percentage of Original Estimate Value
Total $ Overwrites: Total dollar amount of overwrites
Total $ Underwrites: Total dollar amount of underwrites
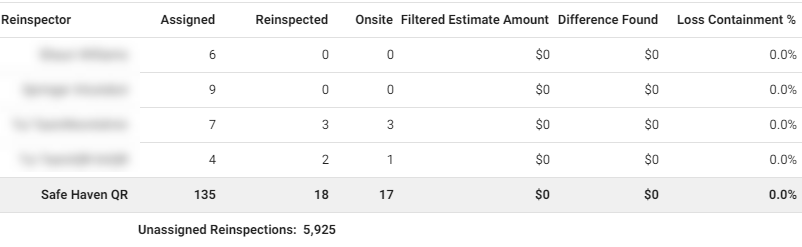
Reinspector Productivity—Filtered
This report tracks the changes a reinspector makes based on the total of the line items, rather than the total estimate amount. The data in this report comes from filtered reinspections performed in Xactimate.
Columns
Reinspector: Reinspector name
Assigned: Number of reinspections assigned
Reinspected: Completed reinspections
Onsite: Onsite reinspections completed
Filtered Estimate Amount: The total estimate dollar amount, based on line items
Filtered Reinspection Amount: Reinspection dollar amount based on filtered total
Difference Found: Dollar amount difference between original estimates and reinspections (Reinspection amount - Filtered Estimate Amount)
Loss Containment %: Percentage difference between reinspection value and filtered estimate value
Economic Opportunity: The sum of overwrites minus the sum of underwrites for the filtered estimate
% Economic Opportunity: Economic opportunity's percentage of filtered estimate value
Filtered Dollar Overwrites: Filtered dollar amount of overwrites for line items changed
Filtered Dollar Underwrites: Filtered dollar amount of underwrites for line items changed
Vendor Reinspection
This report displays reinspection data by vendor (claim rep / contractor), helping you monitor vendor productivity. Only the most current completed reinspection for each estimate is included in the report.
Columns
Claim Rep/Contractor: Claim rep / contractor name
Estimates Reinspected: Number of estimates reinspected
Original Estimate Amount: Original estimate dollar amount
Reinspection Amount: Reinspection dollar amount
Difference Found: Dollar amount difference between original estimates and reinspections (Reinspection Amount - Original Estimate Amount)
Difference %: Percentage difference between reinspection value and original estimate value
Economic Opportunity: The sum of overwrites minus the sum of underwrites (Total $ Overwrites – Total $ Underwrites)
% Economic Opportunity: Economic Opportunity’s percentage of Original Estimate Value
Total $ Overwrites: Total dollar amount of overwrites
Total $ Underwrites: Total dollar amount of underwrites
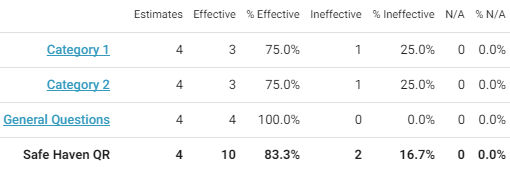
Estimate Claim Review Questions Criteria
This report displays the percentage of estimates categorized as Effective, Ineffective, or N/A for each category on the Claim Review Form. Only the most current completed claim review for each estimate is included in the report.
Select a bar in the graph or a link in the table to see data for other levels of your hierarchy.
Hover over the bars in the graph to see the number of estimates.
Claim Review Questions Criteria graph
This graph shows the percentage of estimates that were effective, ineffective, and N/A for the following categories on the Claim Review Form: Administrative Elements and Technical Elements.
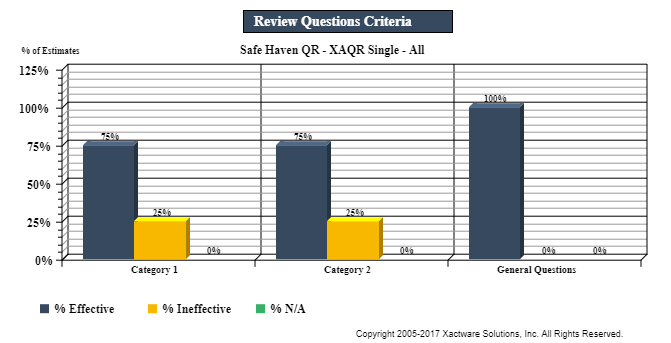
Table columns
Estimates: Total number of estimates
Effective: Number of estimates rated Effective
% Effective: Percentage of estimates rated Effective
Ineffective: Number of estimates rated Ineffective
% Ineffective: Percentage of estimates rated Ineffective
N/A: Number of estimates rated Not Applicable
%N/A: Percentage of estimates rated Not Applicable
Table rows
Claim Review Form categories
Data Set (Safe Haven): Totals
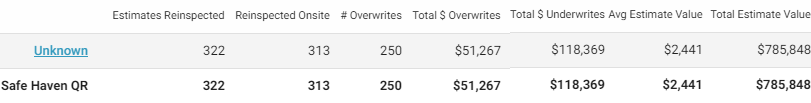
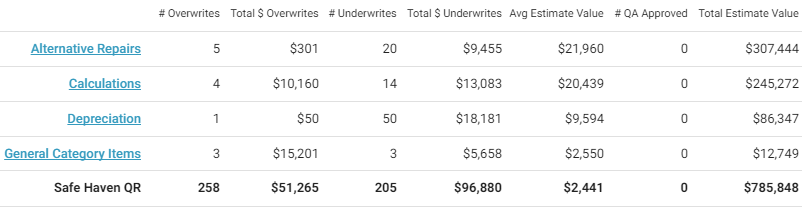
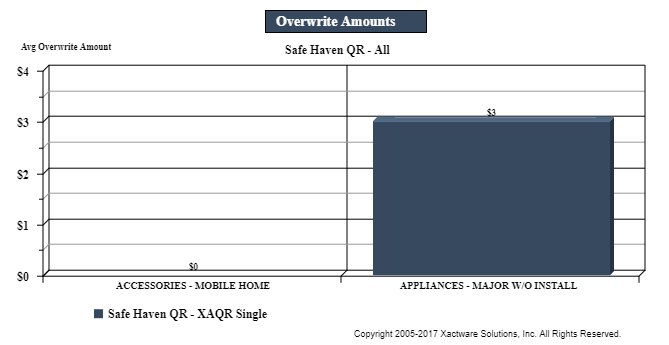
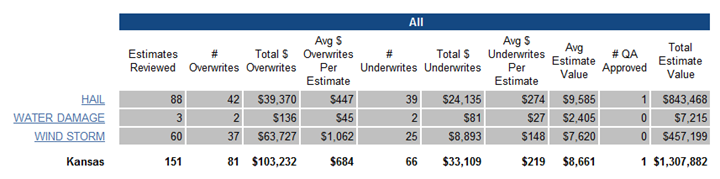
Estimate Claim Review Results by Category
This report displays the number and value of overwrites and underwrites reported during the claim review process for each price list category. Only the most current completed claim review for each estimate is included in the report.
- Select a bar in the graph or a link in the table to see data for other levels of your hierarchy.
- Hover over the bars in the graph to see the total value.
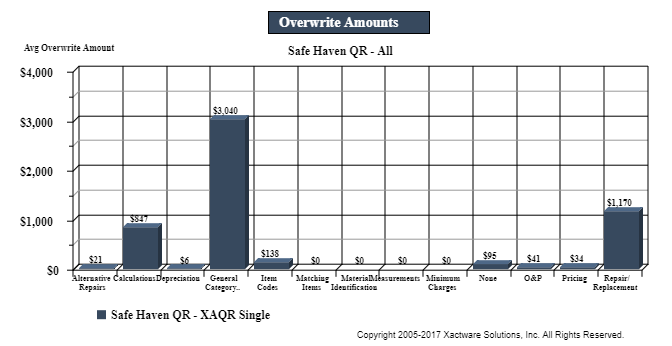
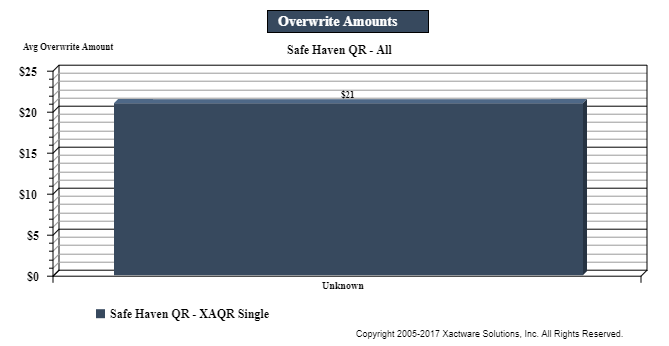
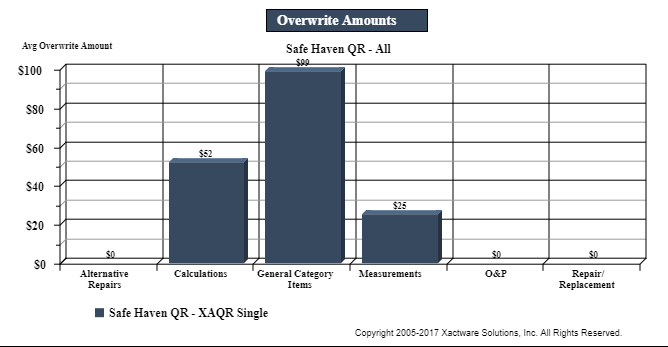
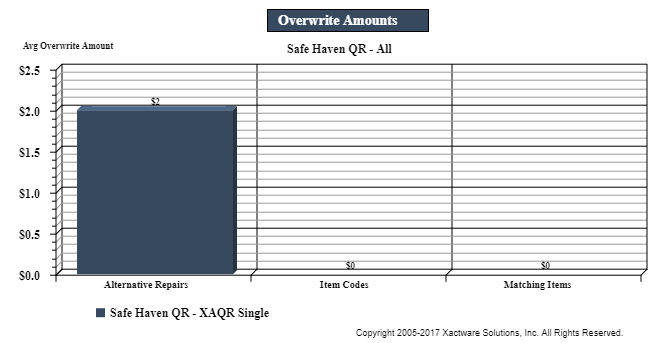
Overwrite Amounts graph
This graph shows the average overwrite dollar amounts for the categories that were selected in the Estimate Exceptions section of the Claim Review Form.
Underwrite Amounts graph
This graph shows the average underwrite dollar amounts for the categories that were selected in the Estimate Exceptions section of the Claim Review Form.
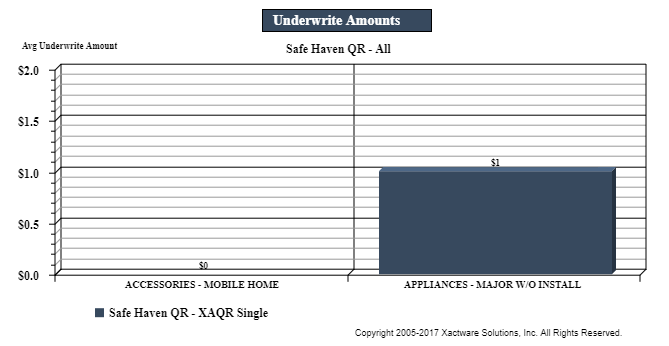
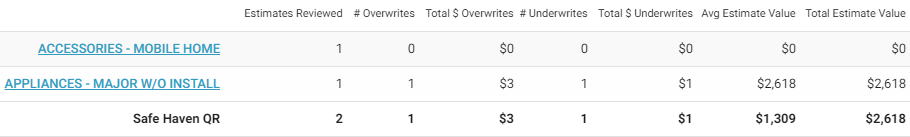
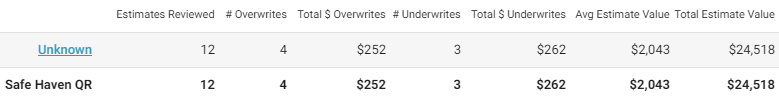
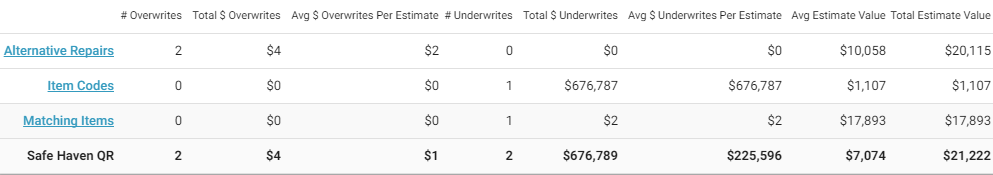
Table columns
Estimates Reviewed: Number of estimates reviewed
# Overwrites: Number of reinspected estimates with overwrites
Total $ Overwrites: Total value of overwrites
Avg $ Overwrites Per Estimate: Average value of overwrites per estimate (Total $ Overwrites / Estimates Reviewed)
# Underwrites: Number of reinspected estimates with underwrites
Total $ Underwrites: Total value of underwrites
Avg $ Underwrites Per Estimate: Average value of underwrites per estimate (Total $ Underwrites / Estimates Reviewed)
Avg Estimate Value: Average estimate value (Total Estimate Value / Estimates Reviewed)
# QA Approved: Number of QA approved estimates
Total Estimate Value: Total estimate value
Table rows
Price list categories
Data Set (Safe Haven): Totals
Estimate Claim Review Results by Cause of Loss
This report displays the number and value of overwrites and underwrites reported during the claim review process for each cause of loss. Only the most current completed claim review for each estimate is included in the report.
- Select a bar in the graph or a link in the table to see data for other levels of your hierarchy.
- Hover over the bars in the graph to see the total value.
Overwrite Amounts graph
This graph shows the average overwrite dollar amounts for the cause of loss categories.
Underwrite Amounts graph
This graph shows the average underwrite dollar amounts for the cause of loss categories.
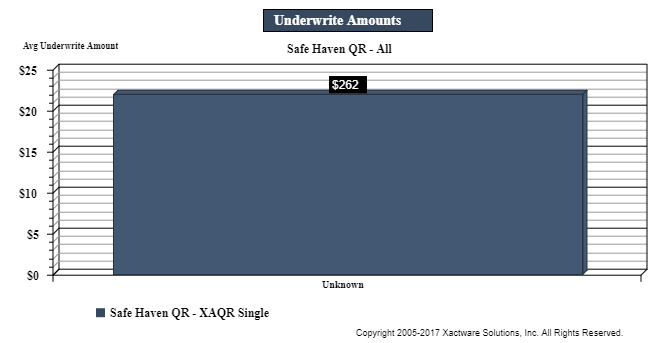
Table columns
Estimates Reviewed: Number of estimates reviewed
# Overwrites: Number of reinspected estimates with overwrites
Total $ Overwrites: Total value of overwrites
Avg $ Overwrites Per Estimate: Average value of overwrites per estimate (Total $ Overwrites / Estimates Reviewed)
# Underwrites: Number of reinspected estimates with underwrites
Total $ Underwrites: Total value of underwrites
Avg $ Underwrites Per Estimate: Average value of underwrites per estimate (Total $ Underwrites / Estimates Reviewed)
Avg Estimate Value: Average estimate value (Total Estimate Value / Estimates Reviewed)
# QA Approved: Number of QA approved estimates
Total Estimate Value: Total estimate value
Table rows
Cause of Loss categories
Data Set (Safe Haven): Totals
Estimate Claim Review Results by Reason
This report displays the number and value of overwrites and underwrites reported during the claim review process for each estimate exceptions reason on the Claim Review Form. Only the most current completed claim review for each estimate is included in the report.
- Select a bar in the graph or a link in the table to see data for other levels of your hierarchy.
- Hover over the bars in the graph to see the total value.
Overwrite Amounts graph
This graph shows the average overwrite dollar amounts for the reasons that were selected in the Estimate Exceptions section of the Claim Review Form.
Underwrite Amounts graph
This graph shows the average underwrite dollar amounts for the reasons that were selected in the Estimate Exceptions section of the Claim Review Form.
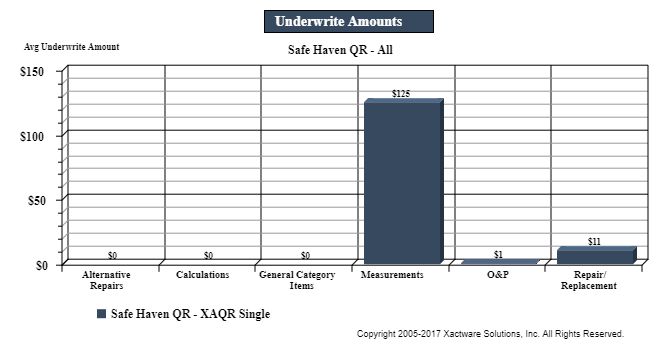
Table columns
Estimates Reviewed: Number of estimates reviewed
Estimates Reviewed with Findings: Number of estimates reviewed with findings
# Overwrites: Number of reinspected estimates with overwrites
Total $ Overwrites: Total value of overwrites
Avg $ Overwrites Per Estimate: Average value of overwrites per estimate (Total $ Overwrites / Estimates Reviewed)
Total Overwrites to Total Estimate $: Ratio of total overwrites value to total estimate value
# Underwrites: Number of reinspected estimates with underwrites
Total $ Underwrites: Total value of underwrites
Avg $ Underwrites Per Estimate: Average value of underwrites per estimate (Total $ Underwrites / Estimates Reviewed)
Total Underwrites to Total Estimate $: Ratio of total underwrites value to total estimate value
Avg Estimate Value: Average estimate value (Total Estimate Value / Estimates Reviewed)
# QA Approved: Number of QA approved estimates
Total Estimate Value: Total estimate value
Table rows
Estimate Exceptions reasons
Data Set (Safe Haven): Totals
Estimate Claim Review Results by Type of Loss
This report displays the number and value of overwrites and underwrites reported during the claim review process for each type of loss on the Claim Review Form. Only the most current completed claim review for each estimate is included in the report.
- Select a bar in the graph or a link in the table to see data for other levels of your hierarchy.
- Hover over the bars in the graph to see the total value.
Overwrite Amounts graph
This graph shows the average overwrite dollar amounts for types of loss.
Underwrite Amounts graph
This graph shows the average underwrite dollar amounts for types of loss.
Table columns
Estimates Reviewed: Number of estimates reviewed
# Overwrites: Number of reinspected estimates with overwrites
Total $ Overwrites: Total value of overwrites
Avg $ Overwrites Per Estimate: Average value of overwrites per estimate (Total $ Overwrites / Estimates Reviewed)
# Underwrites: Number of reinspected estimates with underwrites
Total $ Underwrites: Total value of underwrites
Avg $ Underwrites Per Estimate: Average value of underwrites per estimate (Total $ Underwrites / Estimates Reviewed)
Avg Estimate Value: Average estimate value (Total Estimate Value / Estimates Reviewed)
# QA Approved: Number of QA approved estimates
Total Estimate Value: Total estimate value
Table rows
Type of Loss categories
Hierarchy level (Kansas): Totals
Estimate Calibration Results by Reason
This report displays the number and value of overwrites and underwrites reported during the calibration process for each reason on the Calibration Form. Only the most current completed calibration for each estimate is included in the report.
- Select a bar in the graphs or a link in the table to see data for other levels of your hierarchy.
- Hover over the bars in the graph to see the total value. Subjective describes defines recommend
Overwrite Amounts graph
This graph shows the average overwrite dollar amounts for the following reason categories: material identification, overlap, quality selection, and scope.
Underwrite Amounts graph
This graph shows the average underwrite amounts for the following reason categories: material identification, overlap, quality selection, and scope.
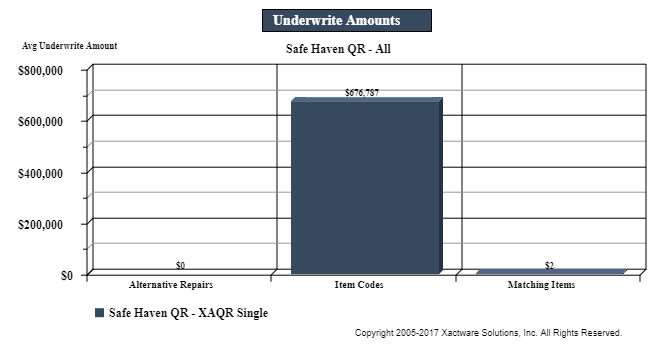
Table columns
Estimates Calibrated: Number of estimates calibrated
Estimates Calibrated with Findings: Number of estimates calibrated with findings
# Overwrites: Number of reinspected estimates with overwrites
Total $ Overwrites: Total value of overwrites
Avg $ Overwrites Per Estimate: Average value of overwrites per estimate (Total $ Overwrites / Estimates Calibrated)
Total Overwrites to Total Estimate $: Ratio of total overwrites value to total estimate value
# Underwrites: Number of reinspected estimates with underwrites
Total $ Underwrites: Total value of underwrites
Avg $ Underwrites Per Estimate: Average value of underwrites per estimate (Total $ Underwrites / Estimates Calibrated)
Total Underwrites to Total Estimate $: Ratio of total underwrites value to total estimate value
Avg Estimate Value: Average estimate value (Total Estimate Value / Estimates Reinspected)
# QA Approved: Number of QA approved estimates
Total Estimate Value: Total estimate value
Table rows
Reason categories
Data Set (Safe Haven): Totals
Calibration Activity
The Calibration Form contains questions regarding the administrative and technical elements of the estimating process. This report displays the calibrator’s answers to these questions for each adjuster/contractor, helping you see adjuster/contractors’ effectiveness. You can view this information for each level of your hierarchy, including for individual adjusters/contractors. Only the most current completed calibration for each estimate is included in the report.