Assignment Volume Report
 Updated
by
Arianne G.
Updated
by
Arianne G.
- Access the Assignment Volume report
- Apply Assignment Filters and Map Settings
- Use the In Progress Assignments table
- Access Assignment Volume results in Advanced Search Results
- Access the Assignment Volume by Zip report
- Apply Assignment Filters and Map Settings
- Use the In Progress Assignments table
- Access Assignment Volume by Zip results in Advanced Search
The Assignment Volume reports enable you to view and sort your company’s assignments. You can filter the assignments by geographic area, type of loss, data set, estimate total, catastrophe status, assignment status, and date range.
The report also displays a catastrophe table with current catastrophe information based on date range, data set, estimate value, type of loss, and state. The data in both the table and map can be based off of the same filters, or the table and map can be filtered independently of each other. You can view all current catastrophes or drill down to one specific catastrophe to see additional detail.
The screen shots in this document are generic, and your company’s interface may vary.
Related: Search, Management/Activity Reports, Industry Trend Reports
Access the Assignment Volume report
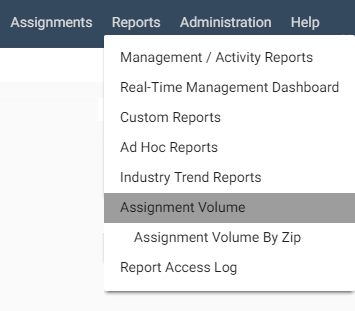
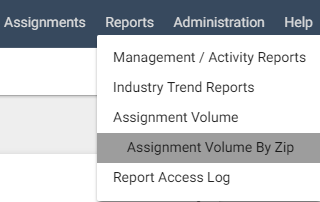
- Select Assignment Volume from the Reports menu. This takes you to the Assignment Volume page.
Apply Assignment Filters and Map Settings
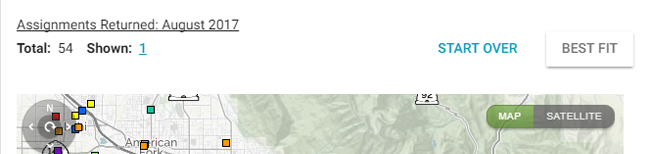
In the Assignment Volume report, you will see a map plotting each assignment’s location.
- In the Assignment Map Filter area, you can filter the assignments by type of loss, data set, estimate total, CAT and non-CAT, date range, or workflow status.
- You can drill down to a specific postal code area in Map Settings.
- Click Submit to apply filters and settings.
- Double click on the map or use the zoom buttons on the left side of the map to zoom in.
When you zoom in, the In Progress Assignments table appears to the right of the map, and adjuster/contractor locations are displayed as colored boxes on the map. The colored boxes correspond to the boxes in the In Progress Assignments table.
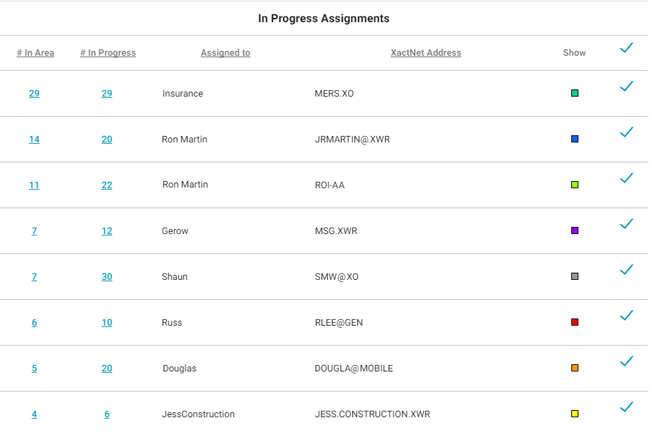
Use the In Progress Assignments table
The In Progress Assignments table shows data for adjusters/contractors with in-progress assignments in the viewable geographic area, including each adjuster/contractor’s XactNet® address, number of total assignments, and number of in-progress assignments.
Each adjuster/contractor is assigned a colored box that corresponds to the colored boxes on the map that shows where each adjuster/contractor’s assignments are located. This information can help you visualize adjuster/contractor workload in a given area.
- Clear the check boxes in the table to remove the colored boxes from the map.

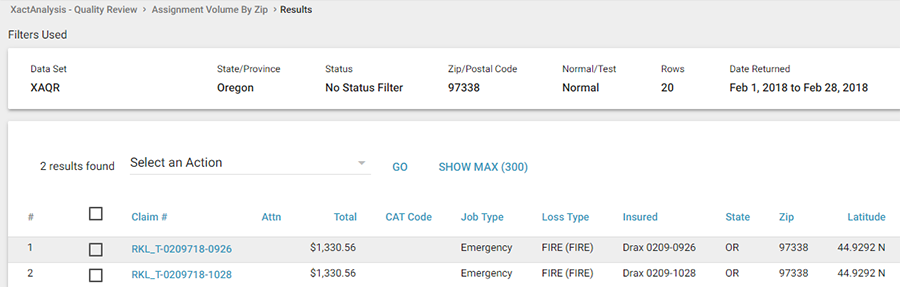
Access Assignment Volume results in Advanced Search Results
- Zoom into an area on the map until the Shown number above the map becomes a hyperlink.
- Click the Shown number hyperlink.
The Assignment Volume results appear in Search. See Search for more information.
Access the Assignment Volume by Zip report
- Select Assignment Volume by Zip from the Reports menu. This takes you to the Assignment Volume by Zip page.
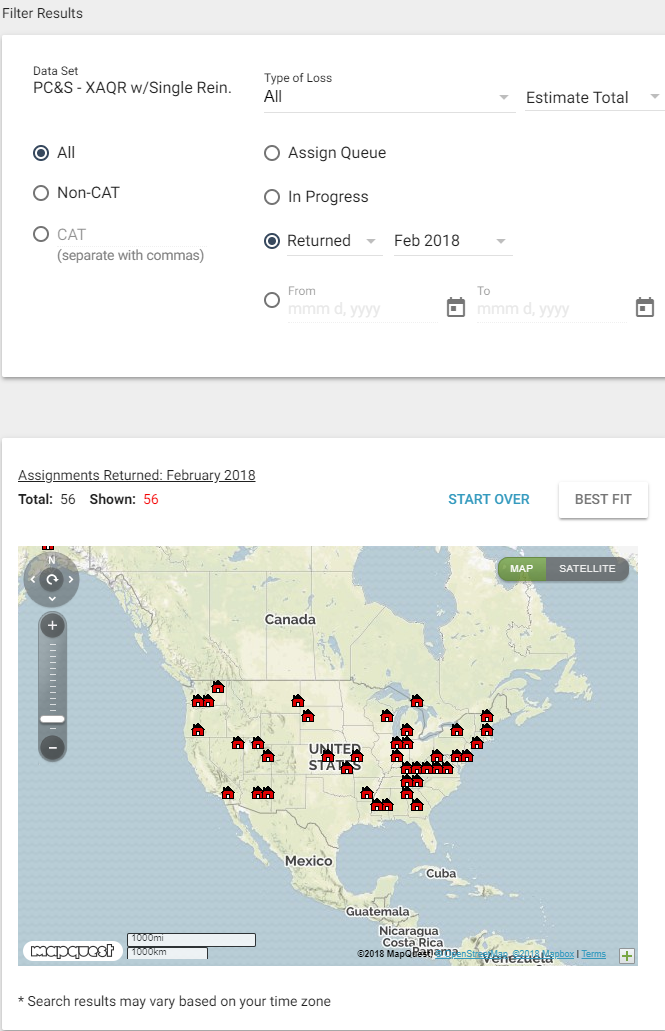
Apply Assignment Filters and Map Settings
In the Assignment Volume report, you will see a map plotting each assignment’s location. States are color coded based on assignment density.
- In the Filter Results area, you can filter the assignments by data set, date range, workflow status, CAT and non-CAT, type of loss, estimate total, or postal code.
- Click Submit to apply filters and settings.
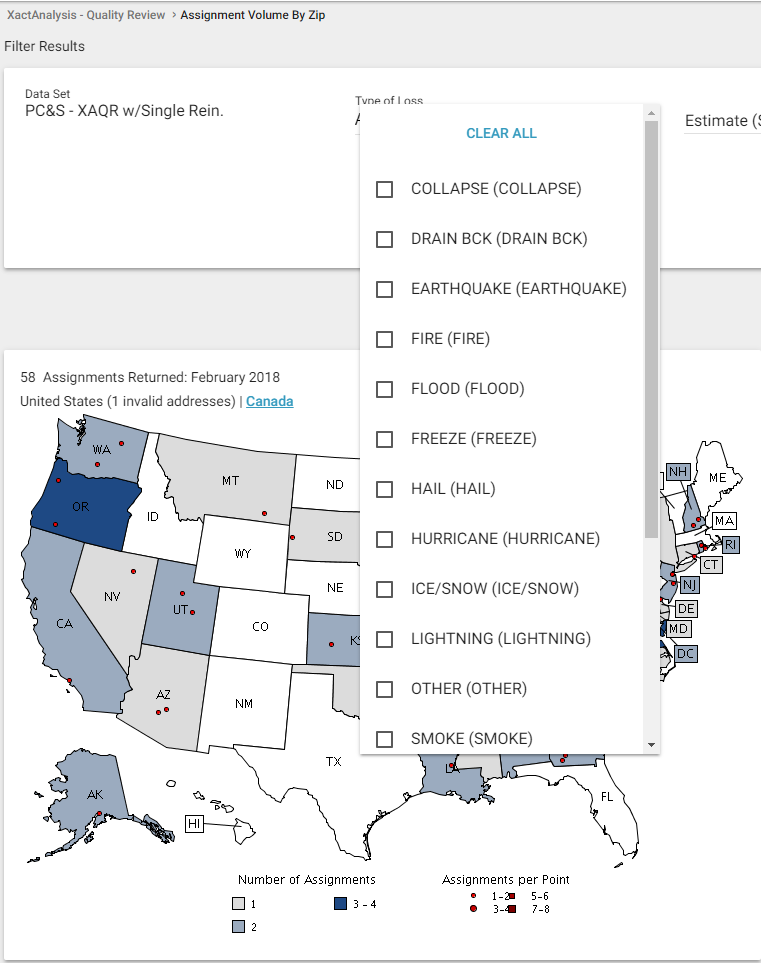
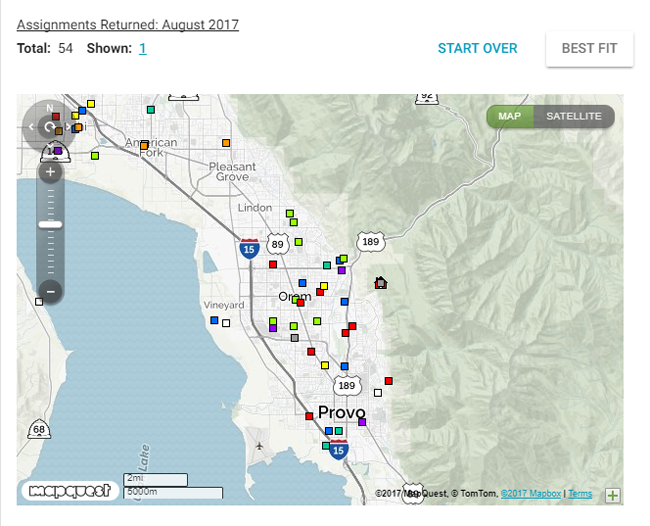
- Click a state and county to see assignments by zip code.
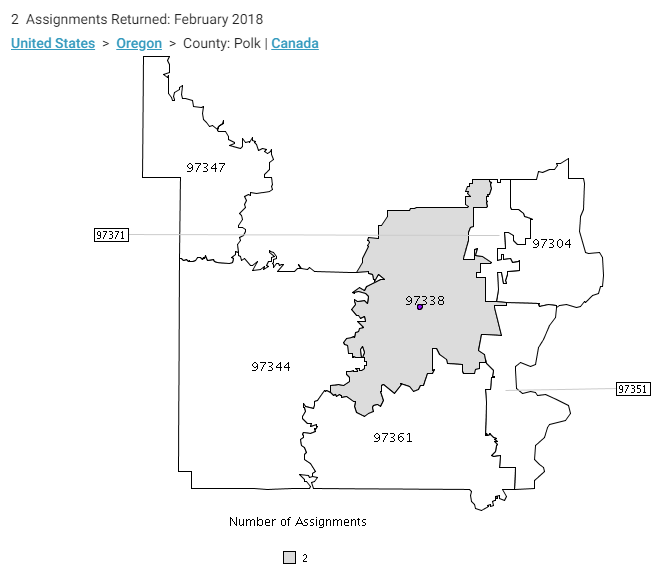
When you view the map at the county level, your available adjuster/contractors’ locations can be displayed as colored circles on the map that correspond to colored boxes in the In Progress Assignments table.
Use the In Progress Assignments table
The In Progress Assignments table shows data for adjusters/contractors with in-progress assignments in the viewable geographic area, including each adjuster/contractor’s XactNet address, number of total assignments, and number of in-progress assignments.
Each adjuster/contractor is assigned a colored box that corresponds to the colored circles on the map and shows where each adjuster/contractor’s assignments are located. This information can help you visualize adjuster/contractor workload in a given area.
- Clear the check boxes in the table to remove the colored circles from the map.
Access Assignment Volume by Zip results in Advanced Search
- Click the zip-code area on the map. The assignment results for that zip code will appear in Search. See Search for more information.