Trend Management Reports
 Updated
by
Arianne G.
Updated
by
Arianne G.
The following Trend management reports are available in XactAnalysis® Quality Review (QR), depending on your company’s settings and your rights. See Management/Activity Reports for help with generating reports.
Estimate Breakdown by Labor/Materials/Equipment
This report displays the average estimate value, labor value, materials value, and equipment value by month for a 6–13 month period. This report can help you track seasonal trends in estimate costs.
- Select a plot point in the graphs or a month in the table to see the data for other levels of your hierarchy, including individual estimates.
Average Estimate Value graph
This graph plots the average estimate value by month.
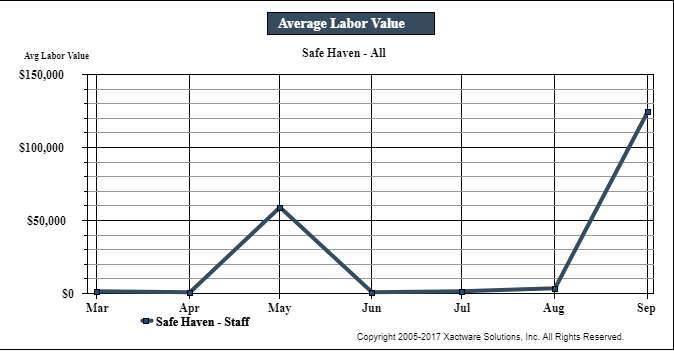
Average Labor Value graph
This graph plots the average value of labor by month.
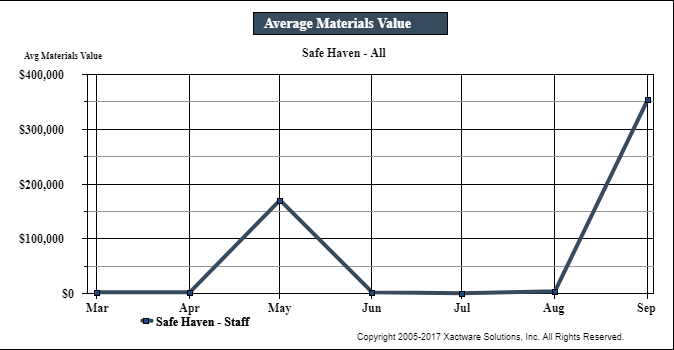
Average Materials Value graph
This graph plots the average value of materials by month.
Average Equipment Value graph
This graph plots the average value of equipment by month.
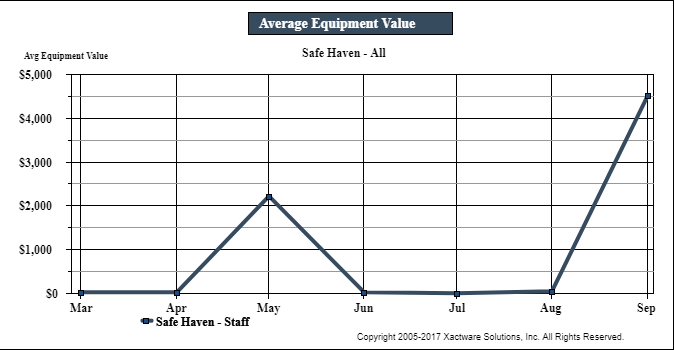
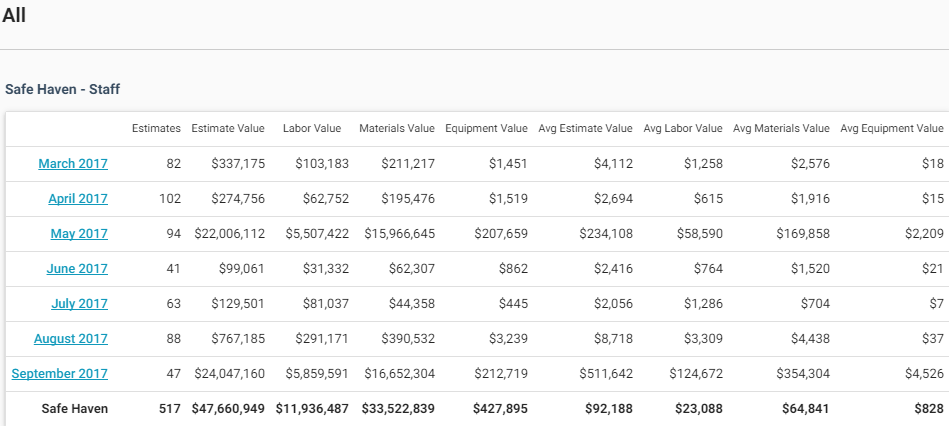
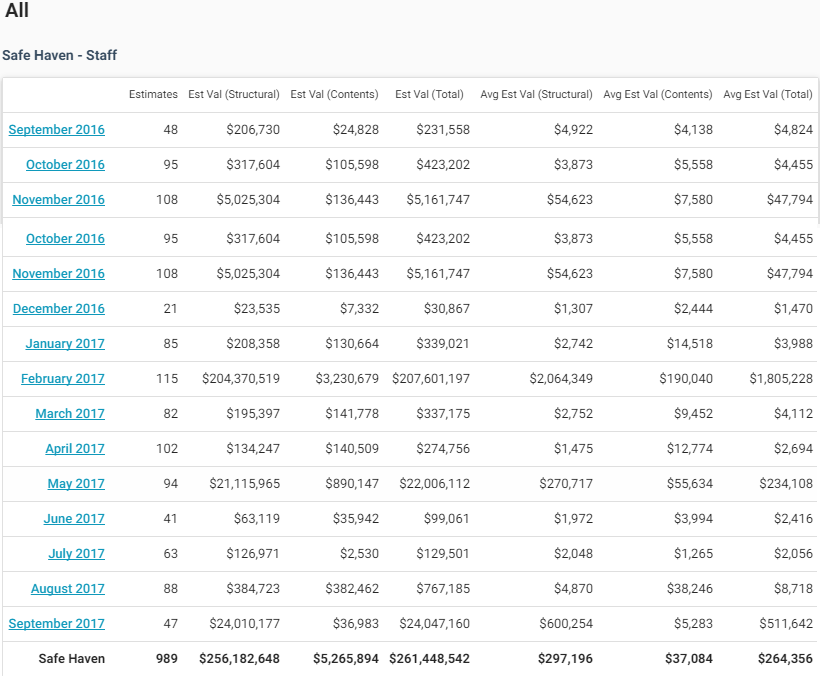
Table columns
Estimates: Number of estimates
Estimate Value: Total estimate value
Labor Value: Labor value
Materials Value: Materials value
Equipment Value: Equipment value
Avg Estimate Value: Average estimate value (Estimate Value / Estimates)
Avg Labor Value: Average labor value (Labor Value / Estimates)
Avg Materials Value: Average materials value (Materials Value / Estimates)
Avg Equipment Value: Average equipment value (Equipment Value / Estimates)
Table rows
First rows: Month and year
Data set (Safe Haven): Totals
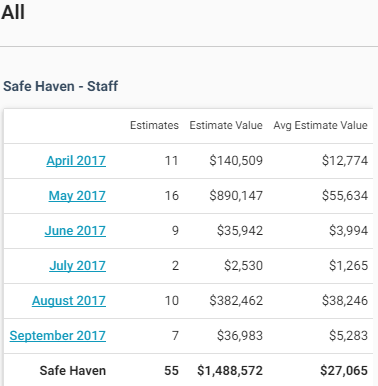
Estimate Trending
This report displays the estimate volume, total estimate value, and average estimate value by month for a 6–13 month period. This report helps you track trends in estimate volume and value.
- Select a plot point in the graphs or a month in the table to see data for other levels of your hierarchy, including adjuster/contractor and estimate.
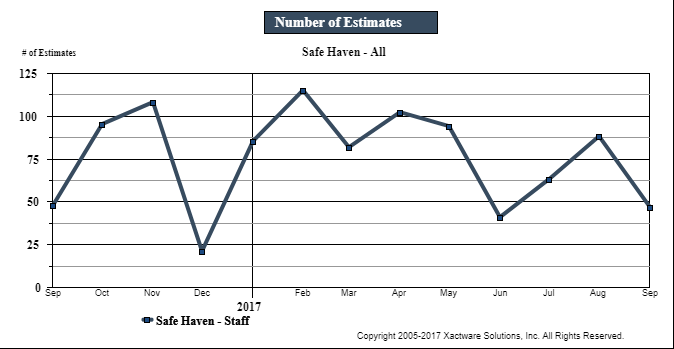
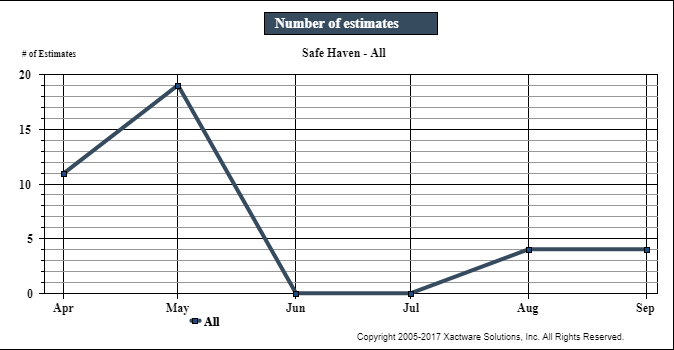
Number of Estimates graph
This graph plots the number of estimates by month.
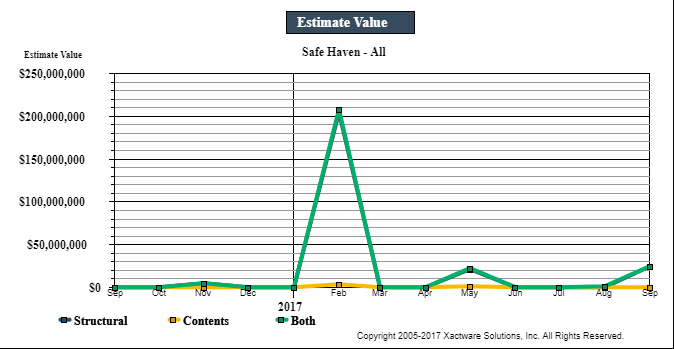
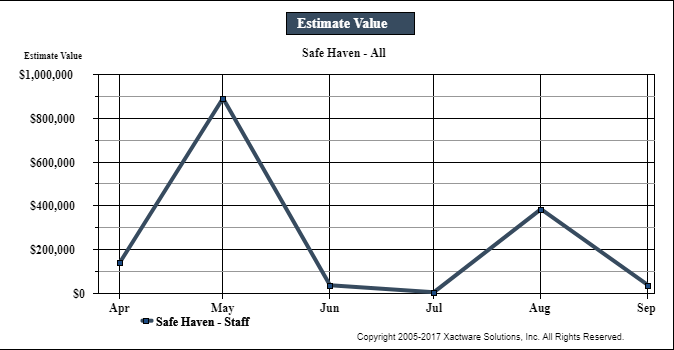
Estimate Value graph
This graph plots the dollar value of estimates by month.
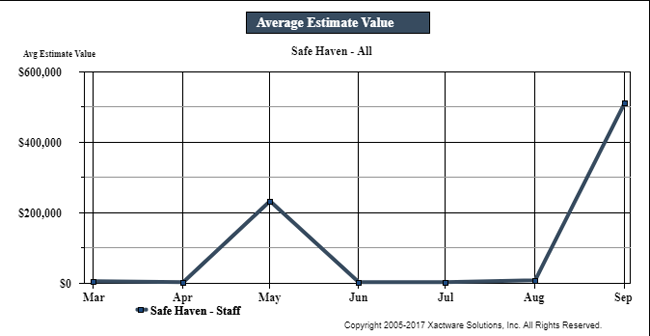
Average Estimate Value graph
This graph plots the average dollar value of estimates by month.
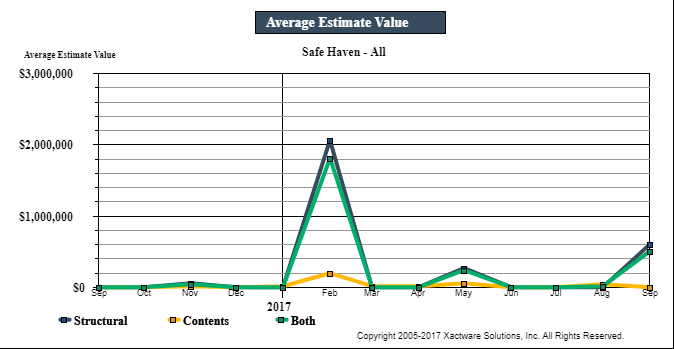
Table columns
Estimates: Number of estimates
Estimate Value: Total estimate value
Avg Estimate Value: Average estimate value per estimate (Estimate Value / Estimates)
Table rows
First rows: Month and year
Data set (Safe Haven): Totals
Estimate Trending for Contents
This report presents contents estimate volume, total value, and average value by month for a 6–13 month period. This report helps you track seasonal trends in contents estimate volume and value.
- Select a plot point in the graphs or a month in the table to see data for other levels of your hierarchy, including contractor/adjuster and estimate.
Number of Estimates graph
This graph plots the number of estimates by month.
Estimate Value graph
This graph plots the estimate value by month.
Average Estimate Value graph
This graph plots the average estimate value by month.
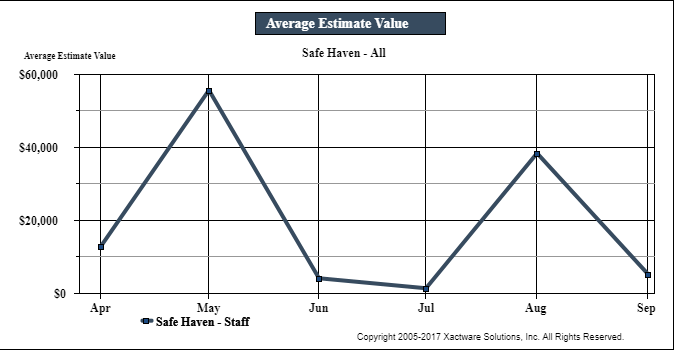
Table columns
Estimates: Number of estimates
Estimate Value: Total estimate value
Avg Estimate Value: Average estimate value (Estimate Value / Estimates)
Table rows
First rows: Month and year
Data set (Safe Haven): Totals